
UTM tagging isn’t meant to be painful.
We make URL tracking manageable.
Aren’t URL builders supposed to help marketers, not make their jobs harder with added manual labor? It’s kinda wild how something like UTM tagging that should (in theory) be so simple has brought on more migraines than measurable metrics. About time we used a tool that simply does its job, so we can do ours.


A better URL creator for Google Analytics UTM tagging
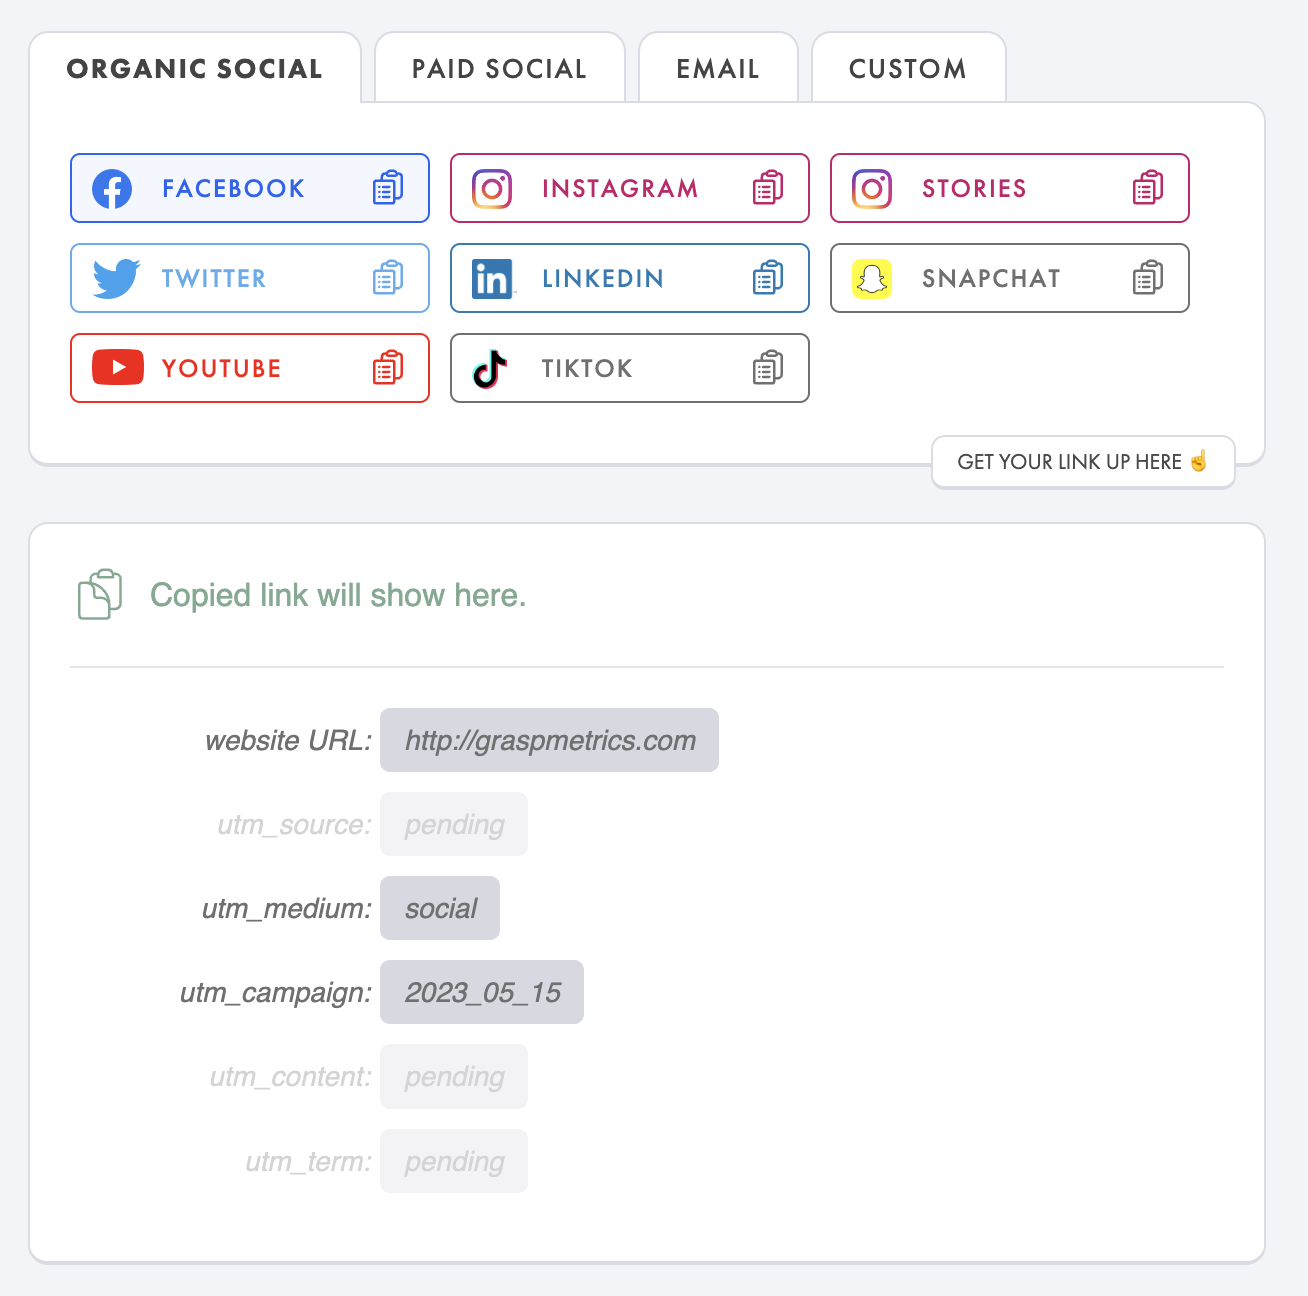
Link Central
UTM tagging can be a slippery slope with your consistency from even the smallest of errors. With Link Central, you'll have a better URL creator that eliminates manual data entry mishaps and ensures accurate tracking. Boost tracking, save time and get your team on the same page with a less daunting, battle-tested URL creator that’s tailored to your requirements.
Declutter your LinkedIn Ads dashboard
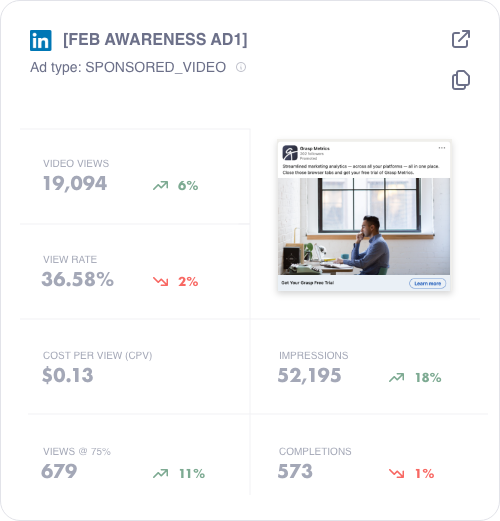
DASH+
Tired of navigating multiple tabs and spreadsheets to gather LinkedIn Ads performance data? Dash+ provides curated reports in one clean view, giving you the insights you need in fewer clicks.
*Earlybird access will be available soon. Join the waitlist below to stay in the loop.